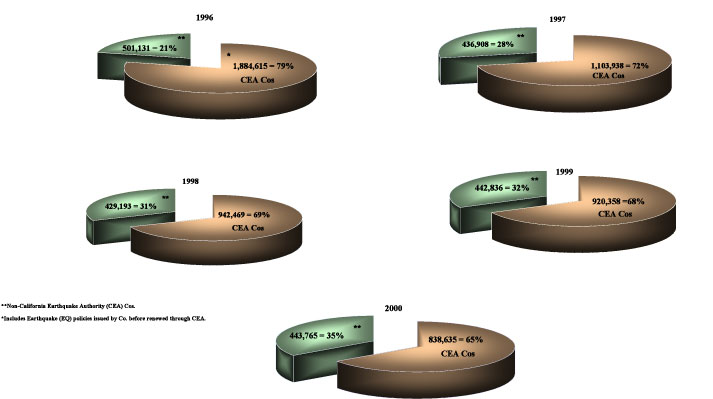
Earthquake Policy Distribution - Exhibit D
Exhibit D illustrates the number of Earthquake (EQ) policies held by CEA and non-CEA Companies. The percentage of policies written through the CEA decreases every year and amounts to 66% of Earthquake policies written in 2000. Whereas the non-CEA companies remained relatively the same since 1997 - increasing approximately 1.6%. Note that while the number of actual CEA policies has declined, the premium has increased as shown in Exhibit B.
Chart (PDF version)

| Year | California Earthquake Authority (CEA) | Non-CEA |
| 1996 | 1,884,615* | 501,131 |
| 1997 | 1,103,938 | 436,908 |
| 1998 | 942,469 | 429,193 |
| 1999 | 920,358 | 442,836 |
| 2000 | 838,635 | 443,765 |
*Includes Earthquake policies issued by CEA member companies before being renewed through a CEA policy.
Summary Tables


