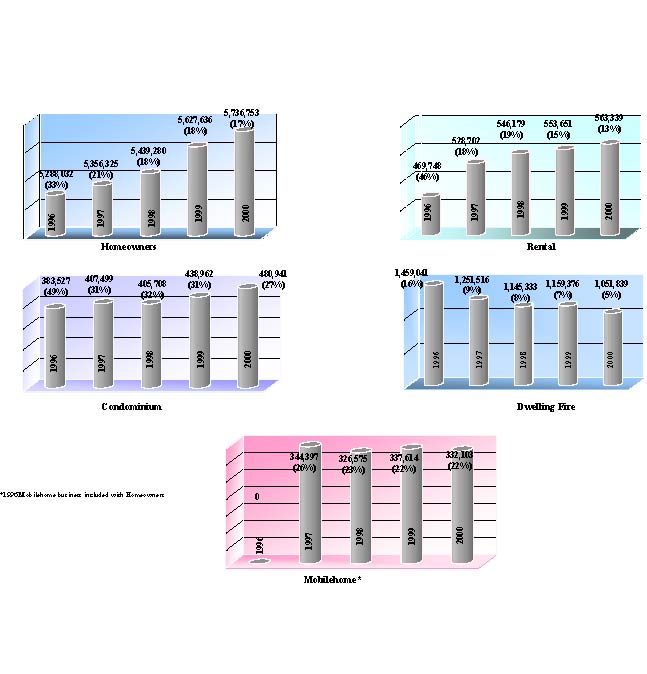
Total Number of Residential Policies In-Force by Coverage Type - Exhibit E
(Revised 10/4/02)
Exhibit E shows the total number of residential policies in-force by coverage and the percentage of those having Earthquake coverage. With the exception of Dwelling Fire and Mobilehome, the overall total number of residential policies increased throughout the five-year period. Although there is a steady increase in the number of policies over the five-year period, the number of policies having Earthquake coverage decreases.
Chart (PDF version)

| Year | Homeowner | EQ % |
Rental | EQ % |
Condo | EQ % |
Dwelling Fire |
EQ % |
Mobilehome | EQ % |
| 1996 | 5,288,032 | 33 | 469,748 | 46 | 383,527 | 49 | 1,459,041 | 16 | 0* | 0 |
| 1997 | 5,356,325 | 21 | 528,702 | 18 | 407,499 | 31 | 1,251,516 | 9 | 344,397 | 26 |
| 1998 | 5,439,280 | 18 | 546,179 | 19 | 405,708 | 32 | 1,145,333 | 8 | 326,575 | 23 |
| 1999 | 5,627,636 | 18 | 553,651 | 15 | 438,962 | 31 | 1,159,376 | 7 | 337,614 | 22 |
| 2000 | 5,736,753 | 17 | 563,339 | 13 | 480,941 | 27 | 1,051,839 | 5 | 332,103 | 22 |
* 1996 Mobilehome business included with Homeowners
Summary Tables


